Comparison: Latitude vs Max Temperature
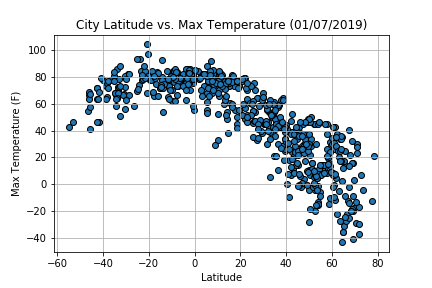
The data is from early January, when is winter in northern hemisphere and summer in southern. In the plot, we are observing negative max temp in high north latitudes, which showcases that it is winter in northern hemisphere and as we go further north, the temp is dropping. Howerver, since it is summer in southern hemisphere, we observe most cities south or equator are above 40 F, having most high tempature observed around tropical area. Entering in antarctic circle (close to 60 deg south), the temparature comes down. Cities close to equator (having low latitude value, positive or negative) are quite warm.